What’s RSI
Understanding RSI and RSI Divergences
Hey traders — Ozy here.
Today we’re diving into one of the most well-known tools in technical analysis: RSI — and more importantly, how to spot divergences that can give you an early heads-up on possible reversals.
What Is RSI?
RSI stands for Relative Strength Index.
It’s a momentum oscillator that measures how strong price movements are — and whether something’s overbought or oversold.
RSI moves between 0 and 100
Above 70? Might be overbought
Below 30? Might be oversold
Simple, right? But here’s where it gets interesting…
What’s a Divergence?
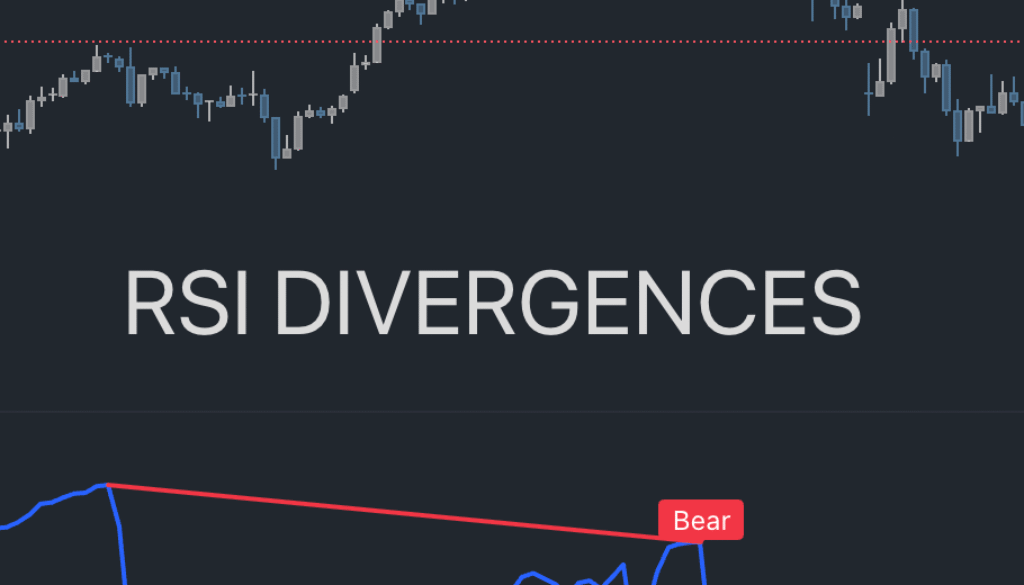
A divergence happens when price is doing one thing, but the RSI is telling a different story.
There are two main types:
Bullish Divergence
Price: Makes a lower low
RSI: Makes a higher low
This suggests momentum is fading on the downside — a possible upward reversal coming.
Bearish Divergence
Price: Makes a higher high
RSI: Makes a lower high
This signals weakening momentum on the upside — a possible pullback or reversal.
But Wait — It’s Not Magic.
Just because you see a divergence doesn’t mean the market will reverse.
It’s a clue — not a command.
That’s why I like combining divergences with candlestick patterns, support/resistance zones, or market structure shifts (yep, we’ll get to all of that in upcoming posts).
Why I Like RSI Divergences (Especially with Python)
Once I learned to code in Python, one of the first things I built was a divergence detector. Why?
Because scanning 50+ charts manually every day sucks.
In future blogs, I’ll share how I code:
Automatic RSI divergence detection
Combining it with candle signals
Backtesting divergence + price action setups
TL;DR
RSI is more than just “buy when oversold” — it can help spot hidden shifts in momentum.
And divergences? They’re like the market whispering, “something doesn’t add up.”
We’re going to turn that whisper into a trading edge — with code, logic, and lots of testing.
Catch you in the next one.
— Ozy
    from tvDatafeed import TvDatafeed, Interval
import mplfinance as mpf
from datetime import datetime, timedelta
import pandas as pd
from ggplot import ggplot
import pandas_ta as ta  # For technical indicators

## Initialize TVDataFeed (no login needed for public data)
tv = TvDatafeed()

## Set parameters
ticker = 'GOOG'
exchange = 'NASDAQ'  # Change if needed for your instrument
start_date = datetime(2024, 1, 1)
end_date = datetime.now()

## Fetch data from TradingView
data = tv.get_hist(
    symbol=ticker,
    exchange=exchange,
    interval=Interval.in_4_hour,  # Daily candles
    n_bars=100,  # Get enough bars to cover your date range
    extended_session=False
)

## Convert to proper DataFrame format
data.index = pd.to_datetime(data.index)
data = data.rename(columns={
    'open': 'Open',
    'high': 'High',
    'low': 'Low',
    'close': 'Close',
    'volume': 'Volume'
})

## Filter for date range
data = data[(data.index >= start_date) & (data.index <= end_date)]

## Calculate RSI
data['RSI'] = ta.rsi(data['Close'], length=14)

## Create panels for RSI
rsi_panel = mpf.make_addplot(data['RSI'], panel=1, color='gray', ylabel='RSI')

## Get the style from the separate file
ggplot_style = ggplot()

## Plot candlestick chart with RSI
mpf.plot(
    data,
    type='candle',
    style=ggplot_style,
    title=f'{ticker} with RSI(14)',
    ylabel='Price ($)',
    volume=False,
    figsize=(12, 8),
    datetime_format='%b %d',
    addplot=rsi_panel,
    panel_ratios=(3, 1)  # Main chart 3x height of RSI panel
)


