Turtle Soup
Turtle Soup Trading Strategy: Catching False Breakouts Like a Pro
If you’ve been trading for a while, you’ve probably heard the old saying:
“The market loves to punish the majority.”
That’s exactly what the Turtle Soup strategy is all about. Instead of chasing breakouts like the crowd, it looks for situations where breakouts are likely to fail—and then takes the opposite side.
The Origin of Turtle Soup
Back in the 1980s, Richard Dennis trained a group of traders known as the “Turtles” to follow trend-following breakout systems. They made millions, but their style had one weakness: false breakouts.
Linda Raschke noticed this flaw and created “Turtle Soup”—a countertrend strategy designed to profit when breakouts fail.
The Core Idea
The Turtle Soup setup is simple:
Look back 20 bars (20-day highs/lows in daily charts).
Identify the most recent 20-bar high or low.
Wait for a fake breakout.
If price pushes past that level but fails to stay there, it’s often a trap.
Enter in the opposite direction.
If the market breaks below the 20-day low and quickly snaps back above it → Go long.
If the market breaks above the 20-day high and quickly reverses → Go short.
Entry Rules (Classic Version)
Price must take out the previous 20-bar high/low.
Enter when price moves back inside the range.
Place a stop beyond the breakout point (a few ticks/pips beyond the high/low).
Why It Works
The psychology is key here:
Breakouts attract trend-followers and stop orders.
If the breakout fails, trapped traders rush to exit → fueling the reversal.
This creates a powerful snapback move you can ride.
Example in Action
Imagine EUR/USD is trading sideways, and the 20-day low is 1.0800.
Price dips to 1.0790 (triggers breakout sellers).
Within hours, it bounces back to 1.0810.
That’s a Turtle Soup long entry → go long, stop at 1.0785, and ride the reversal.
Risk Management Tips
Always use a stop loss—false breakouts don’t always fail.
Stick to liquid markets (FX majors, stock indices, commodities).
Best results come when the breakout happens against the larger trend.
Turtle Soup vs. Classic Breakouts
Classic breakout traders: Buy new highs / sell new lows.
Turtle Soup traders: Do the opposite—fade the breakout.
Both work, but Turtle Soup thrives in range-bound, choppy markets where breakouts often fail.
Final Thoughts
Turtle Soup is a smart contrarian strategy. It reminds us that markets are designed to trap impatient traders. Instead of blindly chasing every breakout, sometimes the best move is to wait for the trap to spring—and then take the other side.
If you’re looking to add a high-probability mean-reversion setup to your playbook, Turtle Soup is worth a taste.
    from tvDatafeed import TvDatafeed, Interval
import pandas as pd
import numpy as np
import matplotlib.pyplot as plt
from mplfinance.original_flavor import candlestick_ohlc
import warnings

warnings.simplefilter(action='ignore', category=FutureWarning)

# Initialize TVDataFeed
tv = TvDatafeed()

# Parameters
ticker = 'XAUUSD'
exchange = 'OANDA'
interval = Interval.in_1_hour
n_bars = 500

# Fetch historical data
print(f"Fetching {n_bars} candles of {ticker} ({interval.name})...")
data = tv.get_hist(
    symbol=ticker,
    exchange=exchange,
    interval=interval,
    n_bars=n_bars,
    extended_session=False
)

# Prepare DataFrame
data.index = pd.to_datetime(data.index)
data = data.rename(columns={'open': 'Open', 'high': 'High',
                            'low': 'Low', 'close': 'Close',
                            'volume': 'Volume'})
data['IndexNum'] = range(len(data))


# -----------------------------
# Turtle Soup Detection
# -----------------------------
def detect_turtle_soup(df, lookback=20):
    """Detect Turtle Soup signals (false breakouts of 20-bar highs/lows)."""
    signals = []
    for i in range(lookback, len(df)):
        high_20 = df['High'].iloc[i - lookback:i].max()
        low_20 = df['Low'].iloc[i - lookback:i].min()
        close = df['Close'].iloc[i]
        prev_close = df['Close'].iloc[i - 1]

        # Turtle Soup Long: Price breaks below 20-bar low, then closes back inside
        if df['Low'].iloc[i] < low_20 and close > low_20:
            signals.append(('LONG', df.index[i], close))

        # Turtle Soup Short: Price breaks above 20-bar high, then closes back inside
        elif df['High'].iloc[i] > high_20 and close < high_20:
            signals.append(('SHORT', df.index[i], close))

    return signals


# Detect Turtle Soup signals
turtle_signals = detect_turtle_soup(data, lookback=20)


# -----------------------------
# Plotting
# -----------------------------
plt.style.use('dark_background')
fig, ax = plt.subplots(figsize=(14, 10), facecolor='#5b6a7a')
ax.set_facecolor('#5b6a7a')

# Prepare OHLC data
ohlc_data = []
for idx, row in data.iterrows():
    ohlc_data.append([row['IndexNum'], row['Open'], row['High'], row['Low'], row['Close']])

candle_width = 0.8 if len(data) < 1000 else 0.6 if len(data) < 2000 else 0.4
candlestick_ohlc(ax, ohlc_data, width=candle_width,
                 colorup='#9ababb', colordown='#ea751d', alpha=0.9)

# Plot Turtle Soup signals with spacing
for signal_type, date, price in turtle_signals:
    idx = data[data.index == date]['IndexNum'].values[0]
    candle = data.loc[date]

    if signal_type == 'LONG':
        signal_y = candle['Low'] - (candle['High'] - candle['Low']) * 0.3  # 30% below candle range
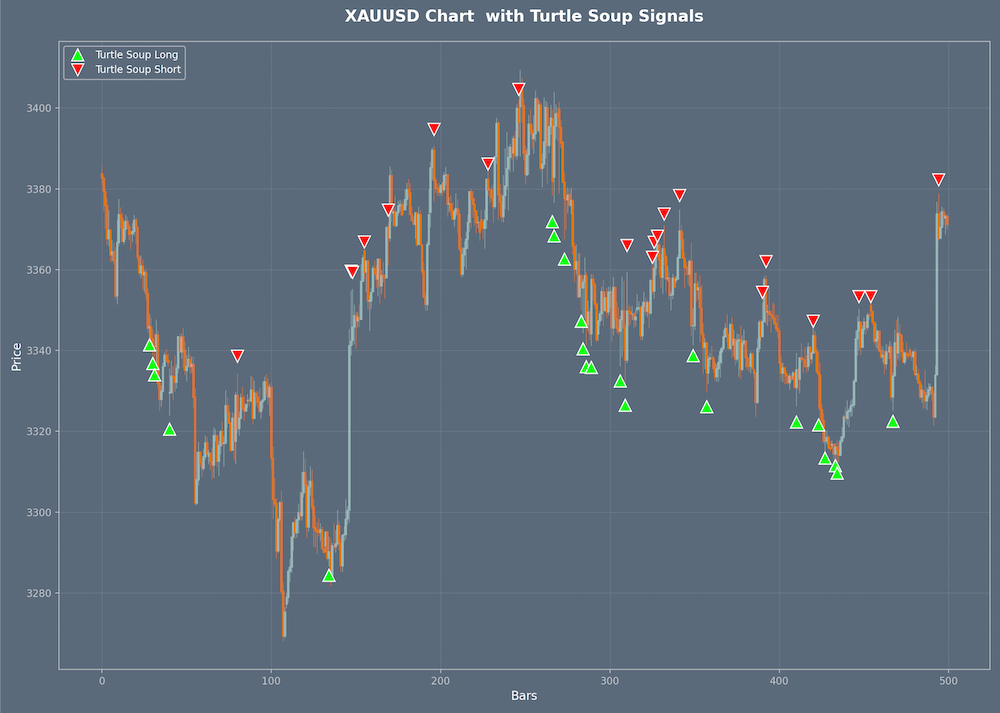
        ax.plot(idx, signal_y, '^', markersize=12, color='#00FF00',
                markeredgecolor='white', markeredgewidth=1.0, label='Turtle Soup Long')

    elif signal_type == 'SHORT':
        signal_y = candle['High'] + (candle['High'] - candle['Low']) * 0.3  # 30% above candle range
        ax.plot(idx, signal_y, 'v', markersize=12, color='#FF0000',
                markeredgecolor='white', markeredgewidth=1.0, label='Turtle Soup Short')

# Title
ax.set_title(f'{ticker} Chart  with Turtle Soup Signals',
             fontsize=16, fontweight='bold', color='white', pad=20)
ax.set_xlabel('Bars', fontsize=12, color='white')
ax.set_ylabel('Price', fontsize=12, color='white')

# Axis colors
text_color = '#c2c5ca'
ax.tick_params(axis='x', colors=text_color)
ax.tick_params(axis='y', colors=text_color)
for spine in ax.spines.values():
    spine.set_color(text_color)

# Grid
ax.grid(True, alpha=0.2, linestyle='--', linewidth=0.5)

# Legend
handles, labels = ax.get_legend_handles_labels()
by_label = dict(zip(labels, handles))  # Remove duplicates
ax.legend(by_label.values(), by_label.keys(), loc='upper left',
          facecolor='#5b6a7a', edgecolor=text_color, fontsize=10)

plt.tight_layout()
plt.show()


# -----------------------------
# Print Summary
# -----------------------------
print(f"\nTurtle Soup Signals for {ticker} ({interval.name}):")
print("=" * 50)
print(f"Total signals: {len(turtle_signals)}")
longs = len([s for s in turtle_signals if s[0] == 'LONG'])
shorts = len([s for s in turtle_signals if s[0] == 'SHORT'])
print(f"  - Long signals: {longs}")
print(f"  - Short signals: {shorts}")
if turtle_signals:
    print("\nRecent signals:")
    for sig in turtle_signals[-5:]:
        print(f"  {sig[0]} on {sig[1]} at price {sig[2]:.2f}")
print("=" * 50)


