Swing Trading
Swing Trading Strategy
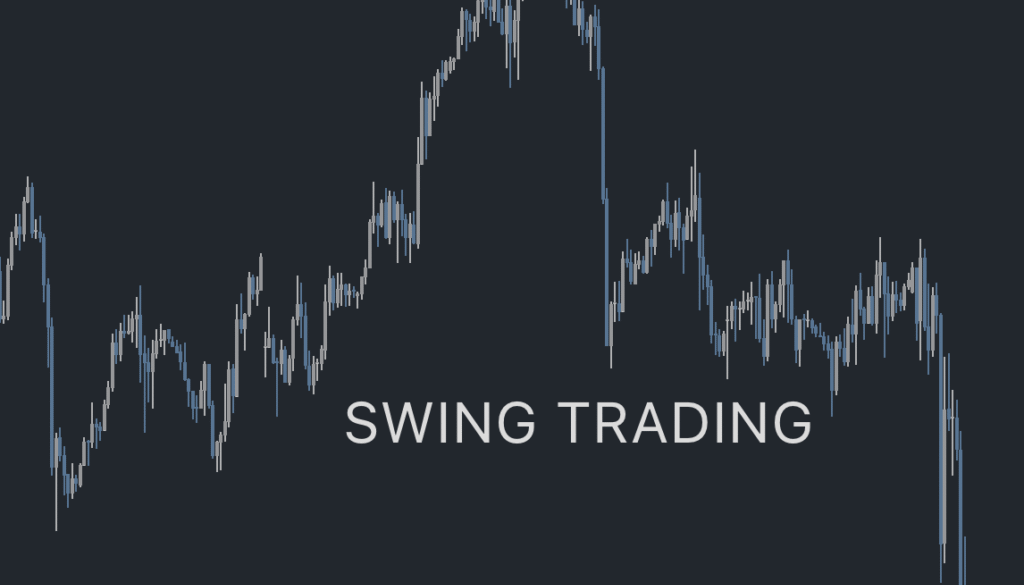
Swing trading is all about catching the “swings” in price — those intermediate moves that occur in trending markets. Whether the market is moving up or down, swing traders aim to ride waves that last from a few days to several weeks.
In this blog, you’ll learn:
What swing trading is
How to spot trade opportunities
When to enter and exit long or short positions
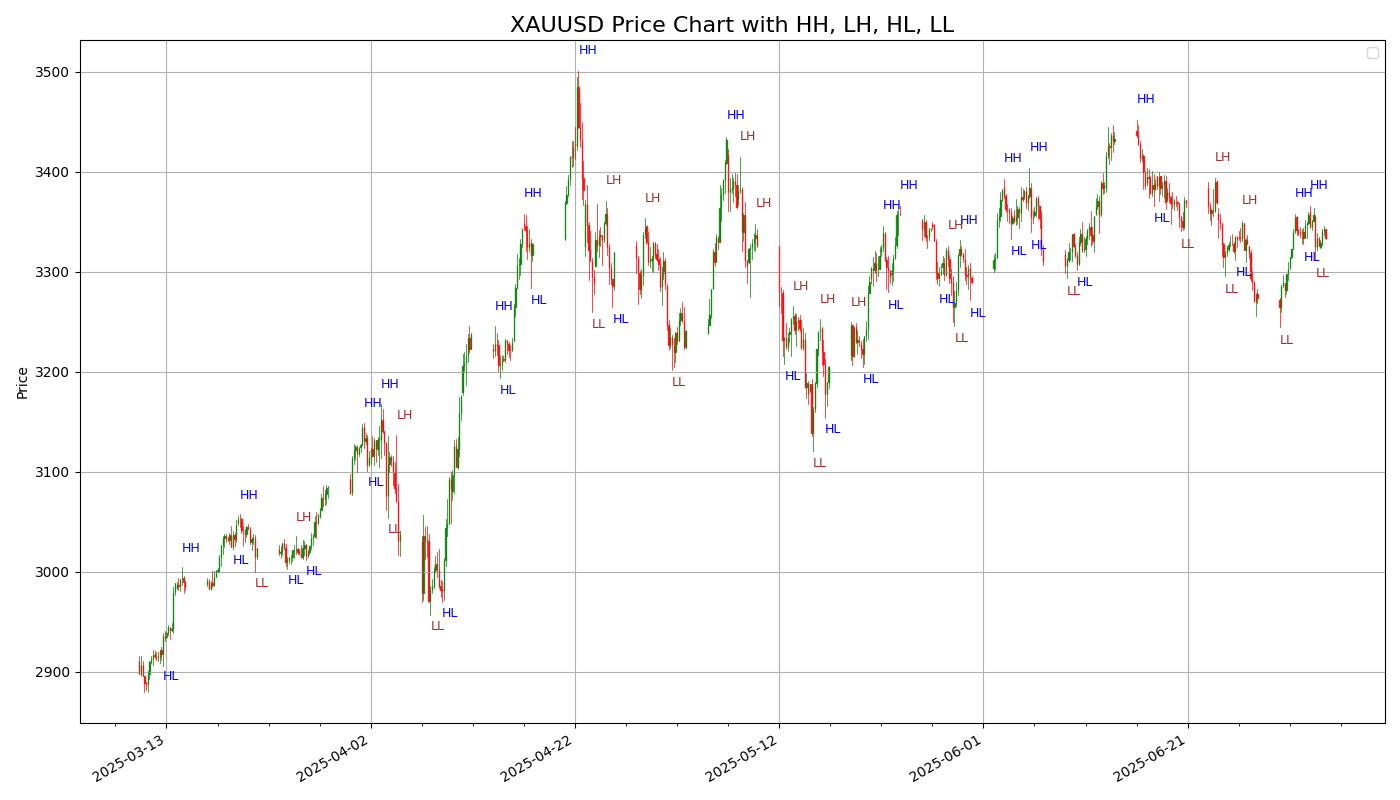
How to use market structure (HH/HL and LH/LL) to stay on the right side of the trend
What Is Swing Trading?
Swing trading focuses on medium-term price movements. Unlike day trading, you’re not looking to be in and out within hours. And unlike long-term investing, you’re not holding for months or years.
Swing traders typically:
Use technical analysis to find entry points
Hold positions for several days to a few weeks
Set clear entry, stop-loss, and take-profit levels before entering a trade
How to Enter and Exit Long Positions
When you’re going long, you’re buying in expectation that the price will rise.
Long Entry Example:
Identify an uptrend — Look for a pattern of Higher Highs (HH) and Higher Lows (HL)
Wait for a pullback to the most recent higher low
Enter the trade after a bullish confirmation (like a strong green candle or bounce)
Set stop-loss just below the recent higher low
Set target at the next resistance or potential higher high
Why this works:
You’re entering in the direction of the trend — after a correction — with a tight stop and a favorable risk/reward ratio.
How to Enter and Exit Short Positions
When you’re going short, you’re selling (or borrowing to sell) in anticipation that the price will fall.
Short Entry Example:
Identify a downtrend — Look for a sequence of Lower Highs (LH) and Lower Lows (LL)
Wait for a rally back to the most recent lower high
Enter the trade after bearish confirmation (like a rejection candle or red bar)
Set stop-loss just above the recent lower high
Set target at the next support or potential lower low
Why this works:
You’re trading with momentum and entering after a minor pullback, increasing the chance of catching the next drop.
Trend Structure: The Power of Highs and Lows
Understanding market structure is one of the most important skills in swing trading. Here’s what to look for:
Uptrend (Bullish):
Higher High (HH): Price exceeds the previous high
Higher Low (HL): Price pulls back but stays above the previous low
Strategy: Buy the higher low expecting a move to a new higher high
Downtrend (Bearish):
Lower Low (LL): Price falls below the previous low
Lower High (LH): Price rebounds but fails to break the previous high
Strategy: Short the lower high expecting a new lower low
Bonus Tips for Swing Traders
Timeframes: Use a higher timeframe (like 1D or 4H) to identify trend direction and structure
Risk Management: Only risk 1-2% of your capital per trade
Confirmation Matters: Wait for confirmation candles or indicators (RSI, MACD) before jumping in
Keep a Journal: Note down your entries, exits, reasoning, and results
Swing trading is simple in theory, but the key is consistency and patience. Learn to read the structure of price movement and align your entries with the trend. Once you master the rhythm of the market, you’ll find high-quality setups more naturally — both long and short.
    from tvDatafeed import TvDatafeed, Interval
import pandas as pd
import numpy as np
import matplotlib.pyplot as plt
from matplotlib.dates import date2num, DateFormatter
from matplotlib.ticker import AutoMinorLocator
from mplfinance.original_flavor import candlestick_ohlc
from scipy.signal import argrelextrema
from datetime import datetime

# Initialize TVDataFeed
tv = TvDatafeed()

# Parameters
ticker = 'XAUUSD'
exchange = 'OANDA'
start_date = datetime(2024, 1, 1)
end_date = datetime.now()

# Fetch historical data
data = tv.get_hist(
    symbol=ticker,
    exchange=exchange,
    interval=Interval.in_4_hour,
    n_bars=500,
    extended_session=False
)

# Prepare DataFrame
data.index = pd.to_datetime(data.index)
data = data.rename(columns={
    'open': 'Open', 'high': 'High',
    'low': 'Low', 'close': 'Close',
    'volume': 'Volume'
})
data = data[(data.index >= start_date) & (data.index <= end_date)]

# Convert to OHLC for candlestick_ohlc
data_ohlc = data[['Open', 'High', 'Low', 'Close']].copy()
data_ohlc['DateNum'] = date2num(data.index.to_pydatetime())
data_ohlc = data_ohlc[['DateNum', 'Open', 'High', 'Low', 'Close']]

# Find Peaks and Valleys
n = 5
high_idx = argrelextrema(data['High'].values, np.greater_equal, order=n)[0]
low_idx = argrelextrema(data['Low'].values, np.less_equal, order=n)[0]

# Define structure labels: HH, LH, HL, LL
labels = []

# Compare recent extrema to previous to assign labels
for i in range(1, len(high_idx)):
    prev = data.iloc[high_idx[i - 1]]['High']
    curr = data.iloc[high_idx[i]]['High']
    label = 'HH' if curr > prev else 'LH'
    labels.append((data.index[high_idx[i]], data['High'].iloc[high_idx[i]], label))

for i in range(1, len(low_idx)):
    prev = data.iloc[low_idx[i - 1]]['Low']
    curr = data.iloc[low_idx[i]]['Low']
    label = 'HL' if curr > prev else 'LL'
    labels.append((data.index[low_idx[i]], data['Low'].iloc[low_idx[i]], label))

# Plotting
fig, ax = plt.subplots(figsize=(14, 8))
candlestick_ohlc(ax, data_ohlc.values, width=0.03, colorup='green', colordown='red', alpha=0.8)

# Annotate structure (HH, LH, HL, LL) closer to candles
for dt, price, lbl in labels:
    x = date2num(dt)
    y = price * (1.005 if lbl in ['HH', 'LH'] else 0.995)  # closer to the candle
    ax.annotate(lbl, xy=(x, y), xytext=(x, y), fontsize=9,
                color='blue' if lbl in ['HH', 'HL'] else 'brown')

# Format
ax.xaxis.set_major_formatter(DateFormatter('%Y-%m-%d'))
ax.xaxis.set_minor_locator(AutoMinorLocator())
fig.autofmt_xdate()
ax.set_title(f"{ticker} Price Chart with HH, LH, HL, LL", fontsize=16)
ax.set_ylabel("Price")
ax.grid(True)
ax.legend()

plt.tight_layout()
plt.show()
