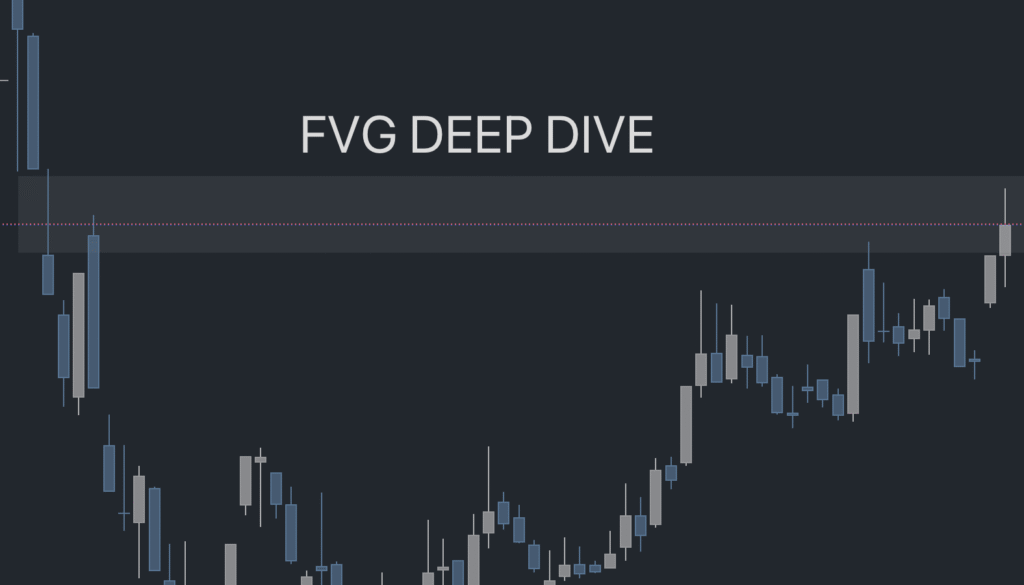
FVG Deep Dive
Mastering Fair Value Gaps (FVG): Advanced Strategies and Applications
In the previous post, we covered the basics of Fair Value Gaps (FVGs)—what they are, how to spot them, and why they matter. Now, let’s take it a step further and explore how professional traders use FVGs to anticipate market moves, refine entries, and manage risk like pros.
1. FVGs in Market Structure
Understanding market structure is key to using FVGs effectively. Not all gaps are created equal:
Trend-Aligned FVGs: When an FVG aligns with the current trend, it often acts as a magnet for price pullbacks, offering high-probability entry points.
Counter-Trend FVGs: Sometimes, a gap appears against the trend, often at exhaustion points. These can signal potential reversals or areas where smart money is taking profits.
Pro Tip: Combine FVG zones with higher highs and higher lows in an uptrend (or lower lows/higher highs in a downtrend) to increase your edge.
2. Partial FVG Fills: The Reality Traders Must Accept
Many novice traders expect FVGs to always be “filled” completely. That’s not always the case.
Partial fills are normal: Price may only touch the edge of the FVG before continuing.
Liquidity hunting: Smart money often uses FVGs to trigger stop orders and collect liquidity. Watching how price reacts at the edge can help you spot institutional footprints.
Example: A bullish FVG zone is between $100–$104. Price retraces to $103, touches the gap, and immediately shoots up. That’s enough confirmation for a trade—even if $101 is never reached.
3. Using FVGs for Trade Entries
Here’s a practical workflow:
Identify the FVG: Spot the gap on a higher timeframe (4H or Daily).
Wait for Retest: Let the market come back to the FVG zone.
Confirm With Price Action: Look for bullish/bearish engulfing candles, pin bars, or rejection wicks.
Combine with Other Indicators: Add RSI, MACD, or EMAs to confirm momentum and trend alignment.
Plan Your Stop Loss & Take Profit: Place stops slightly beyond the gap edge. Target can be the next swing high/low or a risk-reward ratio of at least 1:2.
4. Advanced Concepts
FVG Confluence Zones: Multiple FVGs overlapping across different timeframes create strong support/resistance areas, often leading to explosive moves.
Order Block Integration: FVGs often appear alongside institutional order blocks, which act as liquidity zones. Recognizing this pairing can significantly improve trade accuracy.
Gap-to-Gap Strategies: Some traders look for consecutive gaps as a signal of trend strength or potential exhaustion points.
5. Avoiding Common Mistakes
Ignoring Higher Timeframes: Small-timeframe FVGs often create noise. Always check 4H or Daily charts first.
Trading Without Confirmation: Jumping in without waiting for price reaction leads to poor entries.
Overloading Indicators: FVGs work best with minimal confirmation—too many indicators can dilute your edge.
6. Real-World Example
Imagine a bullish FVG on a 4H chart at $200–$205:
Price previously surged from $190 → $210 in three candles.
The gap zone is $200–$205.
Price retraces back to $203, forming a bullish engulfing candle with RSI support.
This is a high-probability long entry, with stop-loss below $200 and take profit near the next swing high at $215.
In this scenario, the FVG acts as both a liquidity grab zone and a trend continuation signal, giving traders a clear edge.
Key Takeaways from Part 2
FVGs are more than just gaps; they reveal market intent and liquidity zones.
Combining FVGs with market structure, higher timeframes, and price action confirmation drastically improves trade quality.
Partial fills are normal, so focus on reaction and context rather than perfection.
Advanced traders use confluence zones and order block integration to find the best opportunities.
Fair Value Gaps are like a map of the market’s hidden intentions. Once you master identifying, analyzing, and trading them, you start seeing opportunities that others miss.
    #LAST DATA DOWNLOADED 20/08/2025

import pandas as pd
import numpy as np
import matplotlib.pyplot as plt
import matplotlib.dates as mdates
from mplfinance.original_flavor import candlestick_ohlc
from matplotlib.patches import Rectangle
from matplotlib.dates import date2num, DateFormatter
import time
from tvDatafeed import TvDatafeed, Interval
import warnings

warnings.simplefilter(action='ignore', category=FutureWarning)

# Initialize TvDatafeed
tv = TvDatafeed()


# -----------------------------
# Fetch with retry
# -----------------------------
def fetch_data(symbol, n_bars=500, retries=2, sleep_sec=2):
    for attempt in range(retries):
        try:
            df = tv.get_hist(symbol=symbol, exchange='BIST',
                             interval=Interval.in_daily,
                             n_bars=n_bars, extended_session=False)
            if df is not None and not df.empty:
                df.index = pd.to_datetime(df.index)
                df = df.rename(
                    columns={'open': 'Open', 'high': 'High', 'low': 'Low', 'close': 'Close', 'volume': 'Volume'})
                return df
        except Exception as e:
            print(f"Attempt {attempt + 1} failed: {str(e)}")
        time.sleep(sleep_sec)
    return None


# -----------------------------
# FVG Detection (both bullish and bearish)
# -----------------------------
def find_fvg(df):
    """
    Look for FVG patterns (both bullish and bearish):
    Bullish FVG: low[n+2] > high[n]
    Bearish FVG: high[n+2] < low[n]
    Returns list of dicts with FVG zones
    """
    fvg_list = []
    for i in range(len(df) - 2):
        c1, c2 = df.iloc[i], df.iloc[i + 2]

        # Bullish FVG condition
        if c2['Low'] > c1['High']:
            fvg_list.append({
                "type": "bullish",
                "start": df.index[i],
                "end": df.index[i + 2],
                "high": c1['High'],  # upper bound
                "low": c2['Low']  # lower bound
            })
        # Bearish FVG condition
        elif c2['High'] < c1['Low']:
            fvg_list.append({
                "type": "bearish",
                "start": df.index[i],
                "end": df.index[i + 2],
                "high": c1['Low'],  # upper bound (for bearish FVG)
                "low": c2['High']  # lower bound (for bearish FVG)
            })
    return fvg_list


# -----------------------------
# Pullback Detection - Last candle enters any FVG zone
# -----------------------------
def check_last_candle_pullback(df, fvg_list):
    """
    Check if the last candle enters any FVG zone (regardless of when FVG was created)
    and pulls back (closes above 50% of the FVG zone)
    """
    if not fvg_list:
        return None

    last_candle = df.iloc[-1]

    # Check if last candle is bullish
    if last_candle['Close'] <= last_candle['Open']:
        return None

    # Check all FVG zones to see if last candle entered any of them
    for fvg in fvg_list:
        # Check if last candle entered the FVG zone (low <= high and high >= low)
        entered_zone = (last_candle['Low'] <= fvg['high'] and
                        last_candle['High'] >= fvg['low'])

        if entered_zone:
            # Calculate 50% level of FVG zone
            mid = (fvg['high'] + fvg['low']) / 2

            # Check if closed above 50% of FVG zone
            if last_candle['Close'] > mid:
                return {"zone": fvg, "mid": mid, "candle": last_candle}

    return None


# -----------------------------
# Plotting (Focused on FVG only) - EXTENDED to include last candle
# -----------------------------
def plot_fvg_enhanced(df, fvg, symbol):
    # Prepare data
    df_plot = df.copy()
    df_plot['DateNum'] = date2num(df_plot.index.to_pydatetime())
    ohlc_data = df_plot[['DateNum', 'Open', 'High', 'Low', 'Close']].values

    # Set up the plot with dark theme
    plt.style.use('dark_background')
    fig, ax = plt.subplots(figsize=(12, 8), facecolor='#5b6a7a')

    # Plot candlesticks
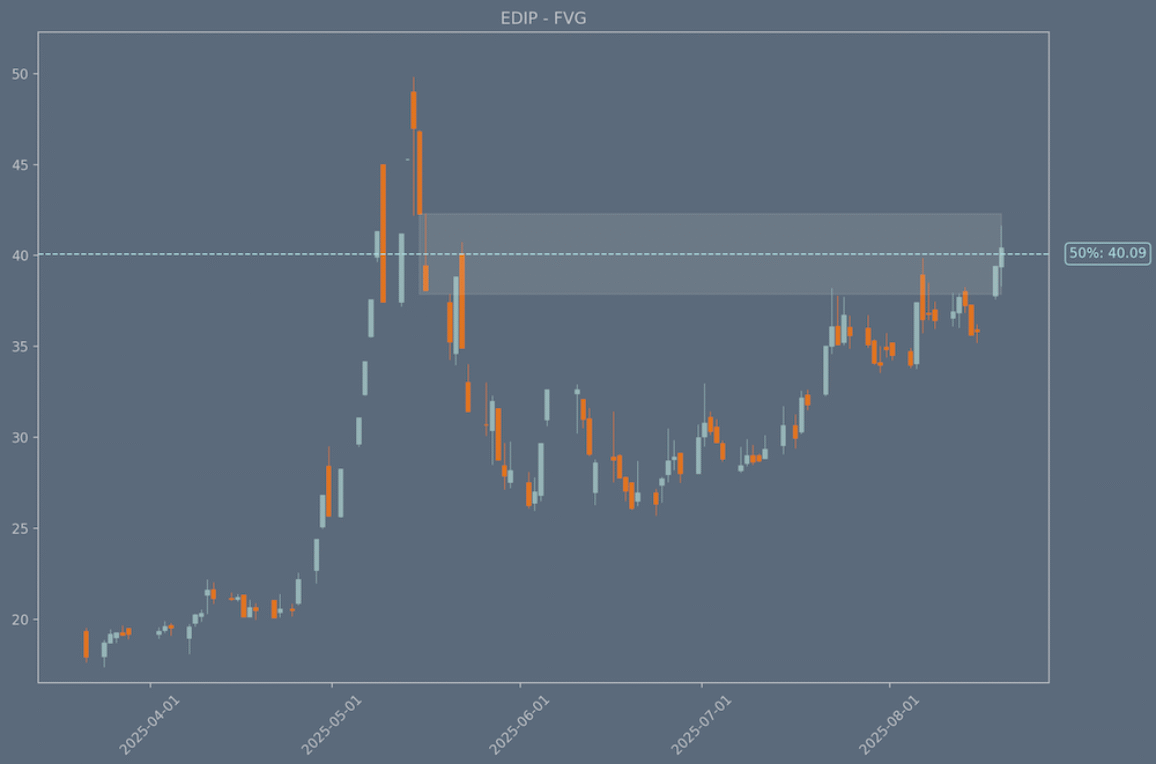
    candlestick_ohlc(ax, ohlc_data, width=0.6,
                     colorup='#9ababb', colordown='#ea751d', alpha=0.9)

    # FVG zone shading - EXTENDED to include last candle
    zone_top = fvg['high']  # The top of the FVG zone
    zone_bottom = fvg['low']  # The bottom of the FVG zone

    # EXTEND the rectangle to include the last candle date
    extended_end = df.index[-1]  # Last candle date

    # Create rectangle for FVG zone (extended to last candle)
    rect = Rectangle((date2num(fvg['start']), zone_bottom),
                     date2num(extended_end) - date2num(fvg['start']),  # Extended width
                     zone_top - zone_bottom,
                     linewidth=1, edgecolor='white', facecolor='white', alpha=0.1)
    ax.add_patch(rect)

    # 50% line - EXTENDED to full chart width
    mid = (zone_top + zone_bottom) / 2
    ax.axhline(mid, color='powderblue', linestyle='--', linewidth=1)

    # Add 50% text label OUTSIDE the chart area (right side)
    # Get the current y-axis limits for positioning
    y_min, y_max = ax.get_ylim()
    text_y_position = mid

    # Position text outside the plot area on the right
    ax.text(1.02,  # x-position (1.0 = right edge, 1.02 = just outside)
            text_y_position,  # y-position (at the 50% line level)
            f'50%: {mid:.2f}',
            color='powderblue',
            va='center',
            ha='left',
            transform=ax.get_yaxis_transform(),  # Use relative coordinates
            bbox=dict(boxstyle="round,pad=0.3", facecolor='#5b6a7a', edgecolor='powderblue', alpha=0.8))

    # Set y-axis limits for price chart
    price_padding = 0.05
    y_min = df['Low'].min() * (1 - price_padding)
    y_max = df['High'].max() * (1 + price_padding)
    ax.set_ylim(y_min, y_max)

    # Set background color
    ax.set_facecolor('#5b6a7a')

    # Set text and axis colors
    text_color = '#c2c5ca'
    ax.xaxis.label.set_color(text_color)
    ax.yaxis.label.set_color(text_color)
    ax.tick_params(axis='x', colors=text_color)
    ax.tick_params(axis='y', colors=text_color)
    for spine in ax.spines.values():
        spine.set_color(text_color)

    # Add proper date formatting
    date_format = DateFormatter('%Y-%m-%d')
    ax.xaxis.set_major_formatter(date_format)
    ax.xaxis.set_major_locator(mdates.AutoDateLocator())

    ax.set_title(f'{symbol} - FVG', color=text_color)

    # Rotate and align x-axis labels
    plt.xticks(rotation=45)
    plt.tight_layout()  # Adjust layout to prevent label cutoff
    plt.show()


# -----------------------------
# Example usage
# -----------------------------
if __name__ == "__main__":
    symbol = "EDIP"

    # Fetch data
    df = fetch_data(symbol, n_bars=100)

    if df is None or df.empty:
        print(f"Failed to fetch data for {symbol}")
    else:
        # Find FVGs
        fvg_list = find_fvg(df)

        if fvg_list:
            print(f"Found {len(fvg_list)} FVG patterns for {symbol}")

            # Check for pullback
            pullback = check_last_candle_pullback(df, fvg_list)

            if pullback:
                print(f"Found FVG pullback for {symbol}")
                plot_fvg_enhanced(df, pullback['zone'], symbol)
            else:
                print(f"No pullback detected. Plotting the most recent FVG pattern")
                # Plot the most recent FVG
                plot_fvg_enhanced(df, fvg_list[-1], symbol)
        else:
            print(f"No FVG patterns found for {symbol}")


