Fractal Trading Strategies
Fractal trading is a method that helps traders identify potential turning points in the market by recognizing repetitive price patterns. These patterns are called fractals—natural occurrences where smaller patterns repeat within larger ones. Think of how branches form on a tree, or how waves form in the ocean—financial markets move in a similar fractal-like structure.
What Is a Fractal in Trading?
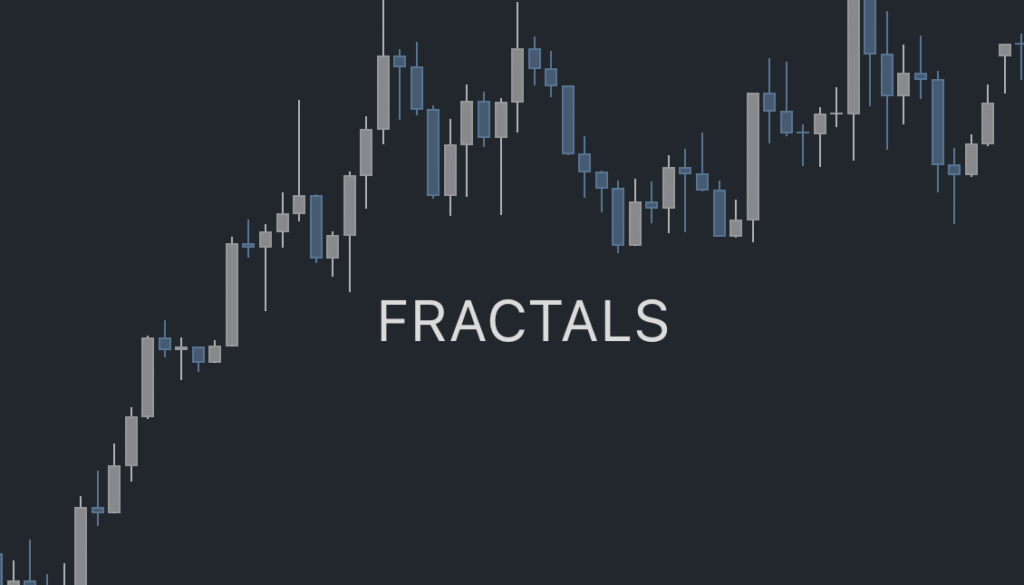
In technical analysis, a fractal is a pattern consisting of five consecutive candlesticks:
The middle candle (the third one) has the highest high or lowest low,
The two candles on each side form lower highs or higher lows respectively.
There are two types of fractals:
Bullish Fractal (Reversal to the upside): Middle candle has the lowest low, surrounded by higher lows.
Bearish Fractal (Reversal to the downside): Middle candle has the highest high, surrounded by lower highs.
Fractals work well for identifying:
Potential support/resistance zones
Entry/exit signals based on price reaction to these zones
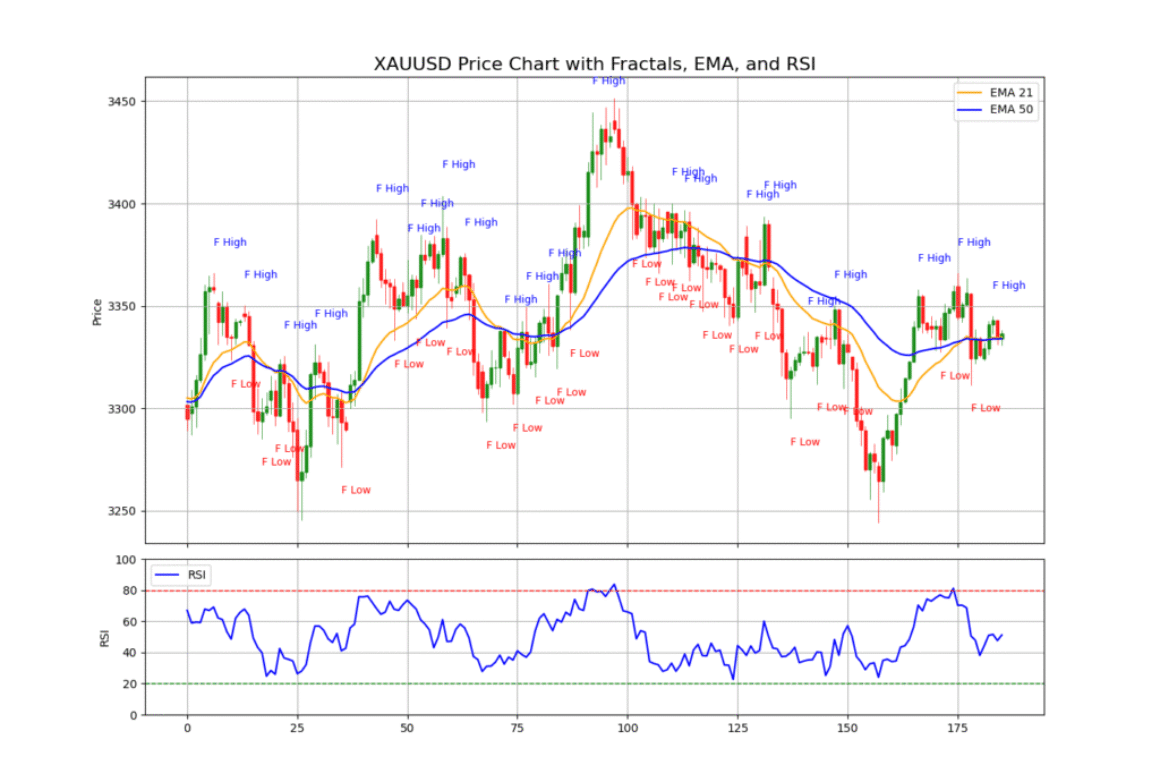
How EMA Supports Fractal Trading
EMA (Exponential Moving Average) is a moving average that gives more weight to recent price data, making it more responsive to current trends. In fractal trading, EMA is useful because:
Trend Confirmation: If a bullish fractal appears above the EMA, it’s more reliable, as price is already in an uptrend.
Filter Trades: You can choose to only take long trades above the EMA or short trades below the EMA, reducing false signals.
Dynamic Support/Resistance: EMA can act as a flexible line where price reacts—adding confluence to a fractal pattern.
Common EMA setups:
EMA 20 or EMA 21 for short-term trend
EMA 50/100/200 for medium to long-term confirmation
How RSI Adds Strength to Fractals
RSI (Relative Strength Index) measures momentum and identifies overbought or oversold conditions. When combined with fractals:
Bullish Fractal + Oversold RSI (<30) → Potential strong buy setup
Bearish Fractal + Overbought RSI (>70) → Potential strong sell setup
RSI Divergence: A fractal appearing while RSI is diverging from price can indicate a trend reversal.
Example: If price forms a new high (bearish fractal), but RSI fails to reach a new high, this bearish divergence suggests the move may not be sustainable.
Example Trading Plan Using Fractals, EMA, and RSI
Wait for a fractal to form (bullish or bearish).
Check EMA:
Bullish fractal → above EMA 21? → Consider long.
Bearish fractal → below EMA 21? → Consider short.
Confirm with RSI:
Is RSI oversold (for bullish) or overbought (for bearish)?
Is there a divergence supporting the fractal?
Final Thoughts
Fractal trading isn’t meant to be used alone. It becomes powerful when combined with trend tools like EMA and momentum indicators like RSI. These tools add context to the pattern and help reduce false signals.
By patiently waiting for confirmation and aligning with the trend, fractal traders can develop a solid edge in the market.
    from tvDatafeed import TvDatafeed, Interval
import pandas as pd
import numpy as np
import matplotlib.pyplot as plt
from matplotlib.ticker import AutoMinorLocator
from mplfinance.original_flavor import candlestick_ohlc
from datetime import datetime
import warnings

warnings.simplefilter(action='ignore', category=FutureWarning)

# Initialize TVDataFeed
tv = TvDatafeed()

# Parameters
ticker = 'XAUUSD'
exchange = 'OANDA'
start_date = datetime(2024, 1, 1)
end_date = datetime.now()

# Fetch historical data
data = tv.get_hist(
    symbol=ticker,
    exchange=exchange,
    interval=Interval.in_4_hour,
    n_bars=200,
    extended_session=False
)

# Prepare DataFrame
data.index = pd.to_datetime(data.index)
data = data.rename(columns={
    'open': 'Open', 'high': 'High',
    'low': 'Low', 'close': 'Close',
    'volume': 'Volume'
})
data = data[(data.index >= start_date) & (data.index <= end_date)]

# Technical Indicators
data['EMA21'] = data['Close'].ewm(span=21).mean()
data['EMA50'] = data['Close'].ewm(span=50).mean()

# RSI Calculation
delta = data['Close'].diff()
gain = delta.clip(lower=0)
loss = -delta.clip(upper=0)
avg_gain = gain.rolling(window=14).mean()
avg_loss = loss.rolling(window=14).mean()
rs = avg_gain / avg_loss
data['RSI'] = 100 - (100 / (1 + rs))

# Drop initial NaN rows
data.dropna(inplace=True)

# Use integer index for plotting instead of actual dates (removes gaps)
data['IndexNum'] = range(len(data))

# Fractals
fractal_labels = []
for i in range(2, len(data) - 2):
    high = data['High'].iloc[i]
    low = data['Low'].iloc[i]

    if high > data['High'].iloc[i - 2:i + 3].drop(data.index[i]).max():
        fractal_labels.append((i, high, 'F High'))
    if low < data['Low'].iloc[i - 2:i + 3].drop(data.index[i]).min():
        fractal_labels.append((i, low, 'F Low'))

# Prepare OHLC
ohlc = data[['IndexNum', 'Open', 'High', 'Low', 'Close']]

# Plotting
import matplotlib.gridspec as gridspec
fig = plt.figure(figsize=(14, 10))
gs = gridspec.GridSpec(2, 1, height_ratios=[3, 1], hspace=0.05)
ax1 = fig.add_subplot(gs[0])
ax2 = fig.add_subplot(gs[1], sharex=ax1)

# Candlesticks
candlestick_ohlc(ax1, ohlc.values, width=0.6, colorup='green', colordown='red', alpha=0.8)
ax1.plot(data['IndexNum'], data['EMA21'], label='EMA 21', color='orange')
ax1.plot(data['IndexNum'], data['EMA50'], label='EMA 50', color='blue')

# Annotate Fractals
for idx, price, lbl in fractal_labels:
    y = price * (1.004 if lbl == 'F High' else 0.996)
    color = 'blue' if lbl == 'F High' else 'red'
    ax1.annotate(lbl, xy=(idx, y), xytext=(idx, y), fontsize=9, color=color)


# RSI subplot
ax2.plot(data['IndexNum'], data['RSI'], label='RSI', color='blue')
ax2.axhline(80, color='red', linestyle='--', linewidth=1)
ax2.axhline(20, color='green', linestyle='--', linewidth=1)
ax2.set_ylabel('RSI')
ax2.set_ylim(0, 100)
ax2.grid(True)
ax2.legend(loc='upper left')

# Format axes
ax1.set_title(f"{ticker} Price Chart with Fractals, EMA, and RSI", fontsize=16)
ax1.set_ylabel("Price")
ax1.grid(True)
ax1.legend()
ax2.grid(True)
plt.setp(ax1.get_xticklabels(), visible=False)
plt.tight_layout()
plt.show()


