Coding for Doji
“Imagine being able to spot indecision in the market instantly. Let’s explore how to make that happen with Python.”
    from tvDatafeed import TvDatafeed, Interval
import mplfinance as mpf
from datetime import datetime, timedelta
import pandas as pd
import numpy as np


# Doji detection functions
def is_doji(row, threshold=0.1):
    """Standard Doji - Open and Close are nearly equal"""
    body_size = abs(row['Close'] - row['Open'])
    total_range = row['High'] - row['Low']
    return body_size <= total_range * threshold


def is_long_legged_doji(row, threshold=0.05, min_wick_ratio=0.4):
    """Long-legged Doji - Small body with long upper and lower shadows"""
    body_size = abs(row['Close'] - row['Open'])
    total_range = row['High'] - row['Low']
    upper_wick = row['High'] - max(row['Open'], row['Close'])
    lower_wick = min(row['Open'], row['Close']) - row['Low']

    return (body_size <= total_range * threshold and
            upper_wick >= total_range * min_wick_ratio and
            lower_wick >= total_range * min_wick_ratio)


def is_gravestone_doji(row, threshold=0.05):
    """Gravestone Doji - Open and Close at low with long upper shadow"""
    body_size = abs(row['Close'] - row['Open'])
    total_range = row['High'] - row['Low']
    upper_wick = row['High'] - max(row['Open'], row['Close'])
    lower_wick = min(row['Open'], row['Close']) - row['Low']

    return (body_size <= total_range * threshold and
            upper_wick >= total_range * 0.5 and
            lower_wick <= total_range * 0.1)


def is_dragonfly_doji(row, threshold=0.05):
    """Dragonfly Doji - Open and Close at high with long lower shadow"""
    body_size = abs(row['Close'] - row['Open'])
    total_range = row['High'] - row['Low']
    upper_wick = row['High'] - max(row['Open'], row['Close'])
    lower_wick = min(row['Open'], row['Close']) - row['Low']

    return (body_size <= total_range * threshold and
            lower_wick >= total_range * 0.5 and
            upper_wick <= total_range * 0.1)


def detect_dojis(data):
    """Detect all types of dojis in the dataframe"""
    data['Doji'] = data.apply(is_doji, axis=1)
    data['LongLeggedDoji'] = data.apply(is_long_legged_doji, axis=1)
    data['GravestoneDoji'] = data.apply(is_gravestone_doji, axis=1)
    data['DragonflyDoji'] = data.apply(is_dragonfly_doji, axis=1)
    return data


# Custom ggplot style
def get_ggplot_style():
    """Returns the custom ggplot style for mplfinance"""
    return mpf.make_mpf_style(
        base_mpl_style='ggplot',
        marketcolors=mpf.make_marketcolors(
            up='#9ababb', down='#ea751d',
            wick={'up': '#9ababb', 'down': '#ea751d'},
            edge={'up': '#9ababb', 'down': '#ea751d'},
            volume='in'
        ),
        gridstyle='',
        facecolor='#5b6a7a',
        figcolor='#5b6a7a',
        rc={
            'axes.labelcolor': '#c2c5ca',
            'xtick.color': '#c2c5ca',
            'ytick.color': '#c2c5ca',
            'axes.edgecolor': '#c2c5ca',
            'text.color': '#c2c5ca',
            'axes.titlepad': 10,
        }
    )


# Main function
def analyze_stock(ticker, exchange, interval=Interval.in_1_minute, n_bars=100):
    """Fetch data and analyze dojis"""
    tv = TvDatafeed()

    # Fetch data
    data = tv.get_hist(
        symbol=ticker,
        exchange=exchange,
        interval=interval,
        n_bars=n_bars,
        extended_session=False
    )

    # Convert to proper DataFrame format
    data.index = pd.to_datetime(data.index)
    data = data.rename(columns={
        'open': 'Open',
        'high': 'High',
        'low': 'Low',
        'close': 'Close',
        'volume': 'Volume'
    })

    # Detect dojis
    data = detect_dojis(data)

    # Print doji counts
    print(f"\nDoji Analysis for {ticker} ({interval.name.replace('_', ' ')} chart):")
    print(f"Standard Dojis: {data['Doji'].sum()}")
    print(f"Long-legged Dojis: {data['LongLeggedDoji'].sum()}")
    print(f"Gravestone Dojis: {data['GravestoneDoji'].sum()}")
    print(f"Dragonfly Dojis: {data['DragonflyDoji'].sum()}")

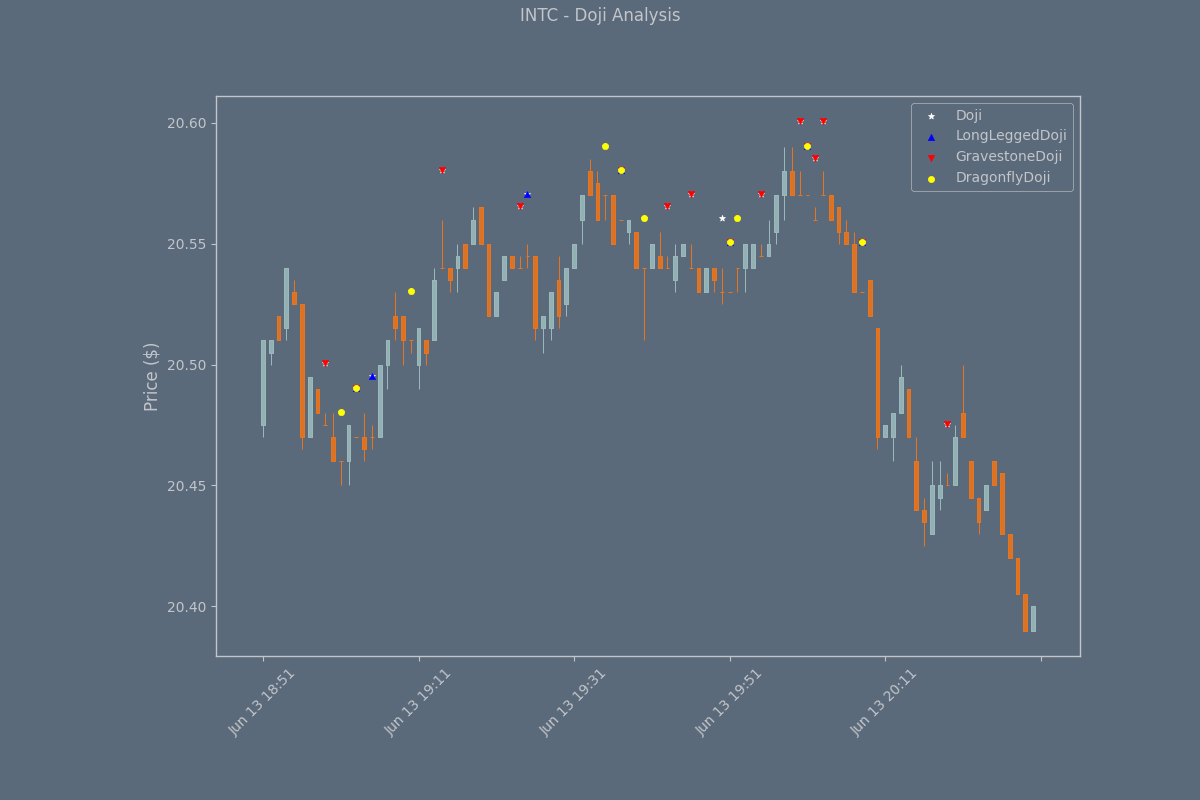
    # Create marker plots - THE CRITICAL FIX
    # In your analyze_stock function, modify the marker creation section:

    # Create marker plots - with adjusted height
    add_doji_markers = []
    marker_offset = 0.001  # Adjust this value to control how far above the candles the markers appear

    for doji_type, marker, color in [
        ('Doji', '*', 'white'),
        ('LongLeggedDoji', '^', 'blue'),
        ('GravestoneDoji', 'v', 'red'),
        ('DragonflyDoji', 'o', 'yellow')
    ]:
        if data[doji_type].any():
            # Create a series with values only at doji points, positioned above the high
            marker_values = data['High'].where(data[doji_type]) * (1 + marker_offset)
            add_doji_markers.append(
                mpf.make_addplot(marker_values,
                                 scatter=True,
                                 markersize=20,
                                 marker=marker,
                                 color=color,
                                 label=doji_type)
            )
    # Plot candlestick chart
    mpf.plot(
        data,
        type='candle',
        style=get_ggplot_style(),
        title=f'{ticker} - Doji Analysis',
        ylabel='Price ($)',
        volume=False,
        figsize=(12, 8),
        datetime_format='%b %d %H:%M',
        addplot=add_doji_markers if add_doji_markers else None,
        savefig=f'{ticker}_doji_analysis.png'
    )

    return data


# Example usage
if __name__ == "__main__":
    ticker = 'INTC'
    exchange = 'NASDAQ'

    # Analyze 5-minute chart
    data_5min = analyze_stock(ticker, exchange, Interval.in_1_minute)

    # Analyze daily chart for comparison
    #data_daily = analyze_stock(ticker, exchange, Interval.in_daily)


July 26, 2025 @ 2:01 pm
I really like what you guys are up too. This sort off clever work and reporting!
Keep up the amazing works guys I’ve incorporated you
guyss to my ownn blogroll. http://Boyarka-Inform.com/
July 29, 2025 @ 6:24 pm
Thank you!!!