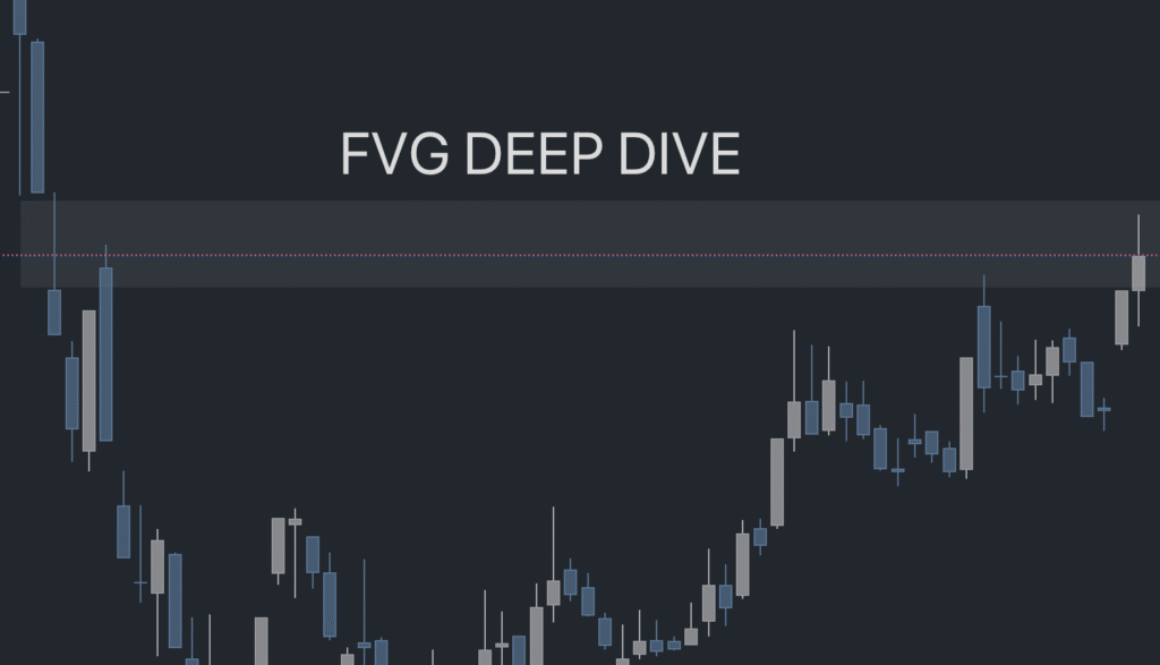
FVG Deep Dive
Mastering Fair Value Gaps (FVG): Advanced Strategies and ApplicationsIn the previous post, we covered the basics of Fair Value Gaps (FVGs)—what they are, how to spot them, and why they matter. Now, let’s take it a step further and explore how professional traders use FVGs to anticipate market moves, refine entries, and manage risk like pros.1. FVGs in Market StructureUnderstanding market structure is key to using FVGs effectively. Not all gaps are created equal:Trend-Aligned FVGs: When an FVG aligns with the current trend, it often acts as a magnet for price pullbacks, offering high-probability entry points.Counter-Trend FVGs: Sometimes, a gap […]
