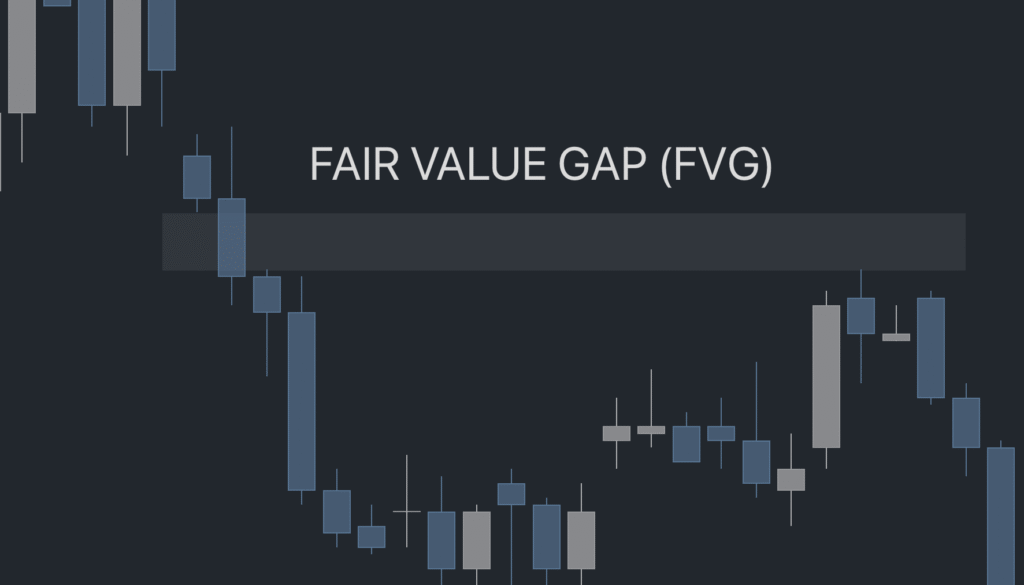
What is Fair Value Gap
So, What Exactly Is a Fair Value Gap?
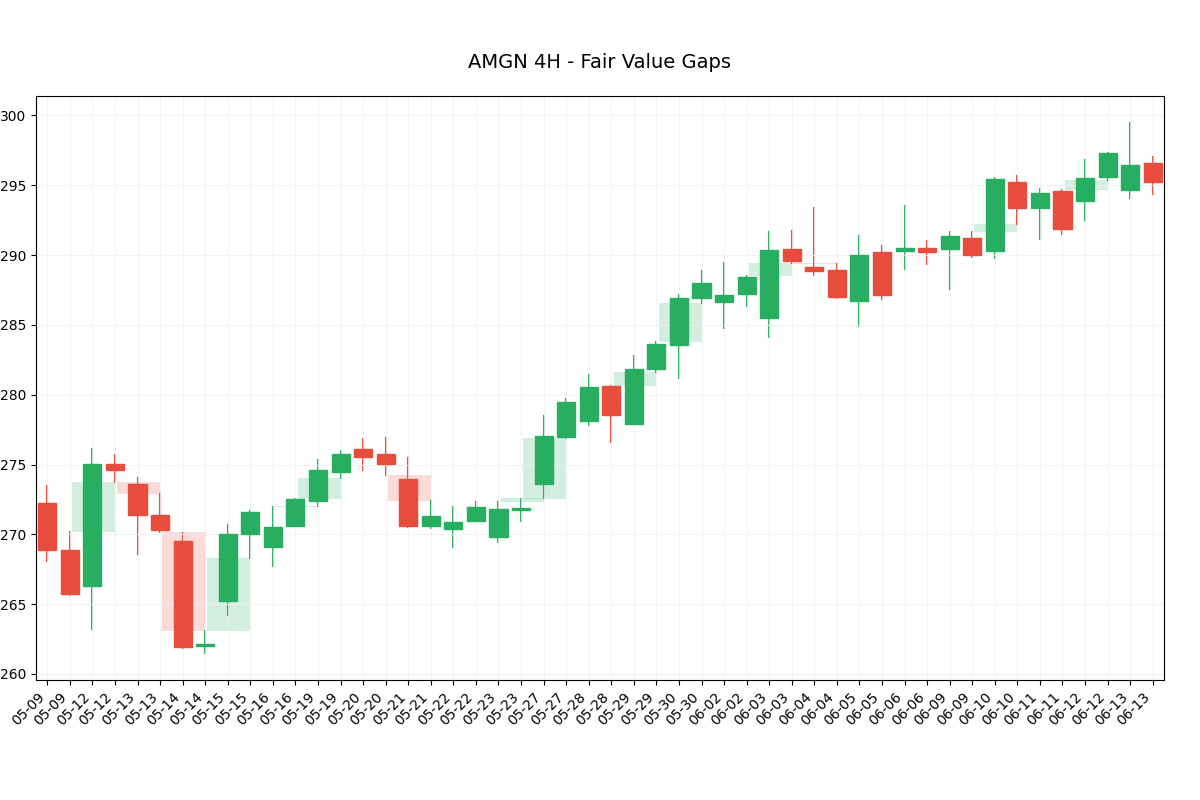
Imagine price is moving really fast, like a speeding car zooming down the highway. Sometimes, the price “skips” a little bit of territory — it just jumps over a range without spending much time there. That skipped area is what we call a Fair Value Gap.
In other words, it’s a gap or imbalance on the chart where not much trading happened, often because buyers or sellers were way stronger in that moment.
Why Should You Care About Fair Value Gaps?
Well, these gaps are kind of like invisible magnets on the chart. The price often likes to come back and fill those gaps before continuing on its way. Traders — especially the pros — watch these areas closely because they often signal good spots to enter or exit a trade.
How Can You Spot a Fair Value Gap?
It’s easier than it sounds! Look for these clues:
Find three candles in a row.
Check if the low of the third candle is above the high of the first candle (for a bullish gap).
Or the high of the third candle is below the low of the first candle (for a bearish gap).
If that’s true, congratulations — you’ve found a Fair Value Gap!
What Does This Mean For Your Trading?
If you see a Fair Value Gap, it might be a sweet spot where price could return for a quick visit. So, you could:
Wait for the price to come back to that gap area.
Look for signs that it’s bouncing off the gap.
Enter your trade with a nice risk/reward setup.
Quick Example
Let’s say you’re watching a chart and see these three candles:
Candle 1 has a high at $100
Candle 3’s low is at $100.50
The low of candle 3 is higher than candle 1’s high, meaning price jumped over a zone without trading in between — that’s your Fair Value Gap!
Pro Tip: Use Fair Value Gaps With Other Tools
Fair Value Gaps are great on their own, but they work even better when combined with:
Support and resistance zones
Trendlines or moving averages
Volume indicators
Wrapping It Up
Fair Value Gaps might sound fancy, but really they’re just areas where the market raced through without stopping. Spotting them can give you a heads-up on where price might revisit, helping you find smarter entries and exits.
Give it a try on your charts and see how it feels — it’s a handy trick in any trader’s toolkit!
    import matplotlib.pyplot as plt
import pandas as pd
import numpy as np
from matplotlib.patches import Rectangle
from datetime import datetime


# ==================== DATA LOADING ====================
def load_data():
    """Smart data loading with multiple fallbacks"""
    # 1. Try live market data first
    try:
        from tvDatafeed import TvDatafeed, Interval
        tv = TvDatafeed()
        data = tv.get_hist(symbol='AMGN', exchange='NASDAQ',
                           interval=Interval.in_4_hour, n_bars=50)
        if data is not None:
            return data.rename(columns={
                'open': 'Open', 'high': 'High',
                'low': 'Low', 'close': 'Close',
                'volume': 'Volume'
            })
    except Exception as e:
        print(f"Live data error: {e}")

    # 2. Fallback to cached data
    try:
        return pd.read_csv('amgn_4h.csv', index_col=0, parse_dates=True)
    except:
        pass

    # 3. Generate realistic sample data
    print("Generating sample data...")
    dates = pd.date_range(end=datetime.now(), periods=50, freq='4H')
    trend = np.linspace(100, 105, 50)
    noise = np.random.normal(0, 0.5, 50)
    close = trend + noise
    return pd.DataFrame({
        'Open': close - np.abs(np.random.normal(0.5, 0.2, 50)),
        'High': close + np.abs(np.random.normal(0.8, 0.3, 50)),
        'Low': close - np.abs(np.random.normal(0.8, 0.3, 50)),
        'Close': close,
        'Volume': np.random.randint(1000, 10000, 50)
    }, index=dates)


data = load_data()
data.index = pd.to_datetime(data.index)


# ==================== FVG DETECTION ====================
def detect_fvg(df):
    """Accurate 3-candle FVG detection"""
    fvgs = []
    for i in range(2, len(df)):
        c1, c3 = df.iloc[i - 2], df.iloc[i]

        if c1['High'] < c3['Low']:  # Bullish FVG
            fvgs.append({
                'type': 'bullish',
                'top': c1['High'],
                'bottom': c3['Low'],
                'left_idx': i - 2,
                'right_idx': i
            })
        elif c1['Low'] > c3['High']:  # Bearish FVG
            fvgs.append({
                'type': 'bearish',
                'top': c3['High'],
                'bottom': c1['Low'],
                'left_idx': i - 2,
                'right_idx': i
            })
    return pd.DataFrame(fvgs)


fvg_df = detect_fvg(data)

# ==================== CHART SETUP ====================
plt.style.use('default')
plt.rcParams.update({
    'figure.facecolor': 'white',
    'axes.facecolor': 'white',
    'axes.grid': True,
    'grid.color': '#f0f0f0',
    'grid.alpha': 0.8
})

fig, ax = plt.subplots(figsize=(12, 8))
fig.subplots_adjust(left=0.03, right=0.97, bottom=0.15)

# ==================== CANDLE PLOTTING ====================
for i, (date, row) in enumerate(data.iterrows()):
    # Color selection
    is_bullish = row['Close'] >= row['Open']
    color = '#27AE60' if is_bullish else '#E74C3C'  # Green/Red

    # Wick (same color as body)
    ax.plot([i, i], [row['Low'], row['High']],
            color=color, linewidth=1.5, zorder=1)

    # Body
    body_top = max(row['Open'], row['Close'])
    body_bottom = min(row['Open'], row['Close'])
    ax.add_patch(Rectangle(
        (i - 0.4, body_bottom), 0.8, body_top - body_bottom,
        facecolor=color, edgecolor=color, zorder=2
    ))

# ==================== WIDE FVG ZONES ====================
for _, fvg in fvg_df.iterrows():
    # Wide positioning
    left = fvg['left_idx'] + 0.1  # Start earlier
    width = fvg['right_idx'] - fvg['left_idx'] - 0.1  # Extend further

    # Semi-transparent zones
    if fvg['type'] == 'bullish':
        color = (39 / 255, 174 / 255, 96 / 255, 0.2)  # Light green
    else:
        color = (231 / 255, 76 / 255, 60 / 255, 0.2)  # Light red

    ax.add_patch(Rectangle(
        (left, fvg['bottom']), width, fvg['top'] - fvg['bottom'],
        facecolor=color, edgecolor='none', zorder=0
    ))

# ==================== FINAL FORMATTING ====================
ax.set_xlim(-0.5, len(data) - 0.5)
ax.set_xticks(range(len(data)))
ax.set_xticklabels([date.strftime('%m-%d') for date in data.index])
plt.xticks(rotation=45, ha='right')

# Smart y-axis scaling
price_range = data['High'].max() - data['Low'].min()
ax.set_ylim(
    data['Low'].min() - price_range * 0.05,
    data['High'].max() + price_range * 0.05
)

plt.title('AMGN 4H - Fair Value Gaps', pad=20, fontsize=14)
plt.ylabel('Price ($)', fontsize=12)
plt.show()


