Stop Hunt in Trading
“Break of Structure & Stop Hunts Explained for Traders”
One of the most common and frustrating things in trading is this scenario:
You analyze the market.
You identify a trend.
You enter a trade.
You place your stop loss just below a recent low or above a recent high.
Then price hits your stop… and reverses perfectly in the direction you expected.
This experience feels like the market is hunting your stop loss on purpose. In reality, this behavior is a natural part of how the market works — and it’s closely tied to something called liquidity.
Let’s break it down.
What Is a Stop Hunt?
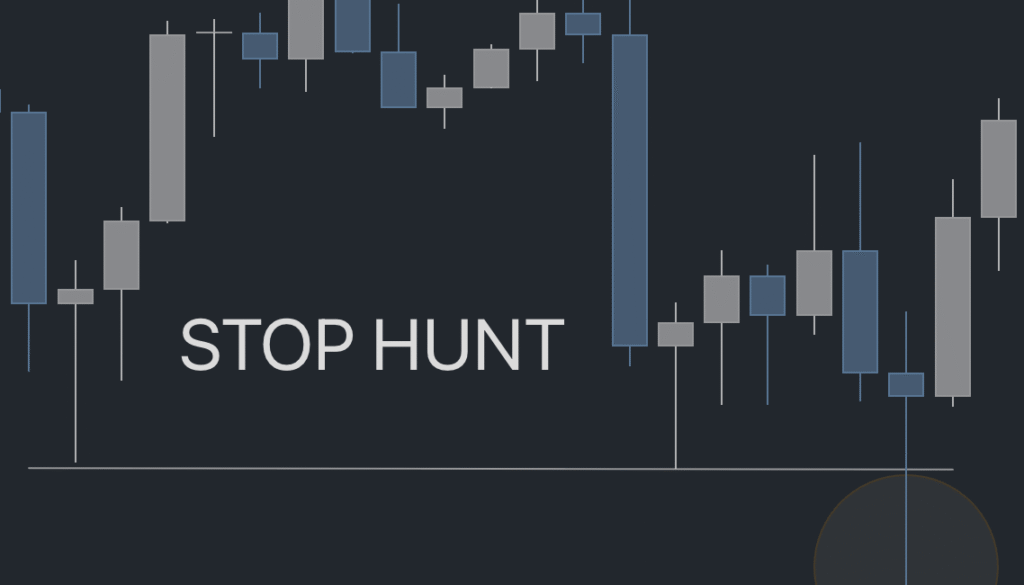
A stop hunt is when price briefly moves beyond a well-known support or resistance level, triggering stop losses that many traders have placed just beyond those levels. This sudden move creates volatility and liquidity.
Why does this happen?
Large institutional traders, also called smart money, need to execute huge orders. But the market needs enough buyers or sellers for them to do this. Retail traders’ stop losses — which are essentially market orders — provide that liquidity.
So the price moves to where the stop losses are.
If price is rising and there are stop losses above a recent high (from short sellers), institutions may push price above that level to trigger those stops and fill their sell orders.
If price is falling and there are stop losses below a recent low (from long traders), the same logic applies — stops are triggered, and institutions can fill their buy orders.
After that, the market often reverses — leaving retail traders stopped out and confused.
What Is Break of Structure (BOS)?
Break of Structure is a clear change in the market’s directional movement. It tells us that the current trend might be ending and a new trend could be starting.
In an uptrend, price makes:
Higher Highs (HH)
Higher Lows (HL)
A break of structure occurs when price fails to make a higher low and instead creates a lower low. That’s the first sign that the uptrend might be reversing.
In a downtrend, price makes:
Lower Highs (LH)
Lower Lows (LL)
A break of structure here would be price failing to make a lower high and instead creating a higher high.
This concept helps traders stay on the right side of the market and not fight the trend.
Putting It Together: Liquidity and Break of Structure
The area just beyond a recent high or low is a liquidity pool — because many traders place their stop losses there.
Smart money knows this. They’ll push price into that zone, grab the liquidity, and then let the real move begin.
Here’s how it often plays out:
Price is in an uptrend and forms a higher low.
Retail traders enter long positions and place stops just below that higher low.
Price dips down, takes out those stops — creating a lower low.
Structure is broken — indicating a potential trend shift.
This is a break of structure caused by a liquidity grab.
How Can You Trade Smarter?
Here are a few tips:
Don’t place your stop loss exactly below the last low or above the last high. That’s where everyone puts it.
Look for signs of a liquidity grab — a strong, fast move that takes out a level, followed by an immediate reversal.
Combine this with tools like RSI or EMA to confirm exhaustion or trend continuation.
Learn to recognize market structure and track higher highs, higher lows, and their breakdowns.
Conclusion
Stop hunts and breaks of structure are not random — they are part of how liquidity is gathered and used by big players. Understanding this can save you from unnecessary losses and help you trade with the flow of the market instead of against it.
    from tvDatafeed import TvDatafeed, Interval
import pandas as pd
import numpy as np
import matplotlib.pyplot as plt
from matplotlib.ticker import AutoMinorLocator
from mplfinance.original_flavor import candlestick_ohlc
from datetime import datetime
import warnings

warnings.simplefilter(action='ignore', category=FutureWarning)

# Initialize TVDataFeed
tv = TvDatafeed()

# Parameters
ticker = 'XAUUSD'
exchange = 'OANDA'
start_date = datetime(2024, 1, 1)
end_date = datetime.now()

# Fetch historical data
data = tv.get_hist(
    symbol=ticker,
    exchange=exchange,
    interval=Interval.in_4_hour,
    n_bars=300,
    extended_session=False
)

# Prepare DataFrame
data.index = pd.to_datetime(data.index)
data = data.rename(columns={
    'open': 'Open', 'high': 'High',
    'low': 'Low', 'close': 'Close',
    'volume': 'Volume'
})
data = data[(data.index >= start_date) & (data.index <= end_date)]

# Use integer index for plotting instead of actual dates (removes gaps)
data['IndexNum'] = range(len(data))

# Add signal column
data['Signal'] = None

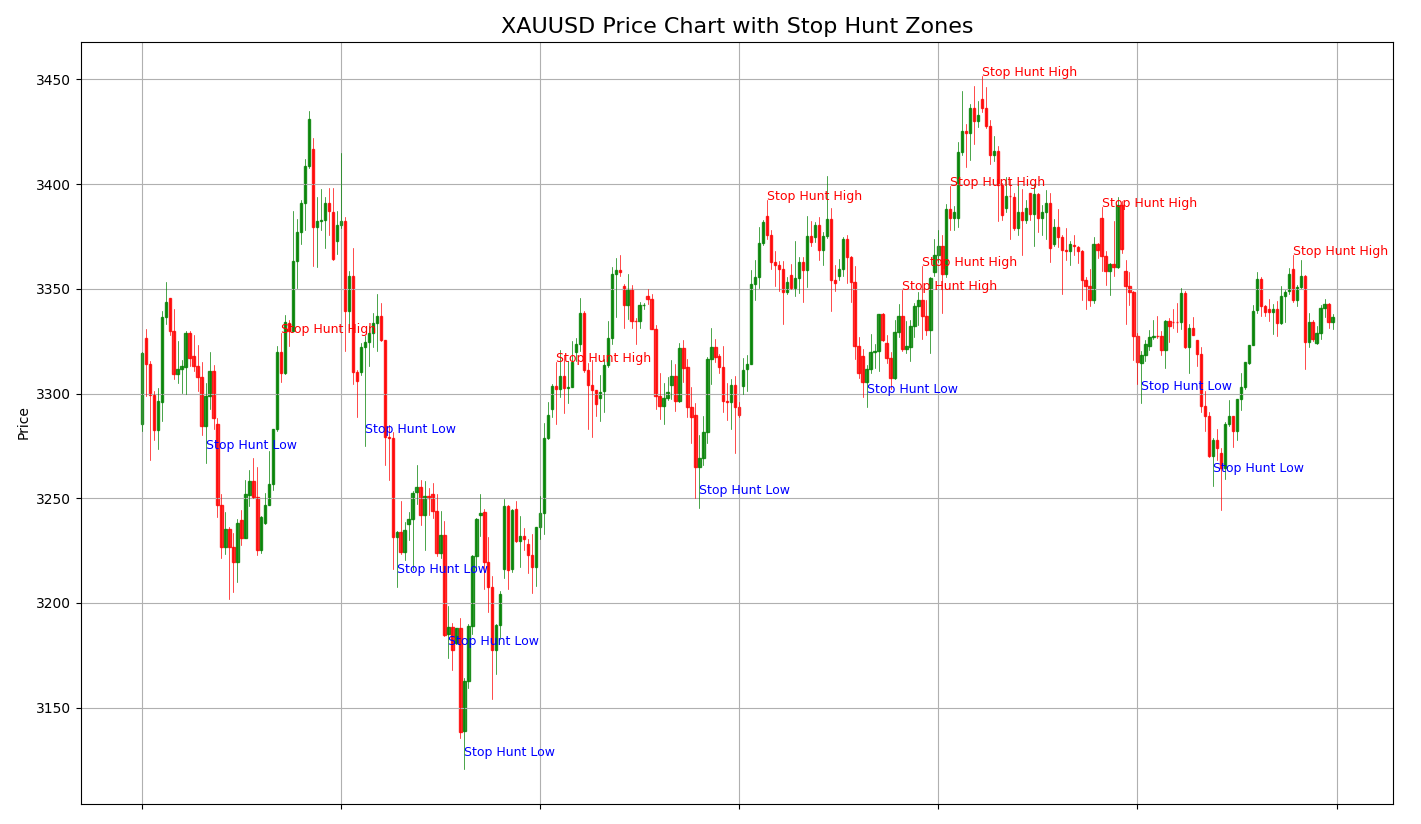
# --- Detect Stop Hunts and Generate Entry Signal for Next Candle ---
lookback = 10
stop_hunts = []

for i in range(lookback, len(data) - 1):  # leave last candle for next entry
    recent_high = data['High'].iloc[i - lookback:i].max()
    recent_low = data['Low'].iloc[i - lookback:i].min()
    current_high = data['High'].iloc[i]
    current_low = data['Low'].iloc[i]
    current_open = data['Open'].iloc[i]
    current_close = data['Close'].iloc[i]

    # Stop Hunt High (bearish trap) — Entry signal (optional)
    if current_high > recent_high * 1.001 and current_close < current_open:
        data.loc[data.index[i + 1], 'Signal'] = 'Short'
        stop_hunts.append((i, current_high, 'Stop Hunt High'))

    # Stop Hunt Low (bullish trap) — Entry signal (optional)
    if current_low < recent_low * 0.999 and current_close > current_open:
        data.loc[data.index[i + 1], 'Signal'] = 'Long'
        stop_hunts.append((i, current_low, 'Stop Hunt Low'))

# Prepare OHLC data for plotting
ohlc = data[['IndexNum', 'Open', 'High', 'Low', 'Close']]

# --- Plotting ---
fig, ax = plt.subplots(figsize=(14, 8))

# Candlesticks
candlestick_ohlc(ax, ohlc.values, width=0.6, colorup='green', colordown='red', alpha=0.8)

# Annotate Stop Hunts
for idx, price, lbl in stop_hunts:
    if lbl == 'Stop Hunt High':
        y = price * 1
        color = 'red'
    else:
        y = price * 1.002
        color = 'blue'
    ax.annotate(lbl, xy=(idx, y), xytext=(idx, y), fontsize=9, color=color)

# Format
ax.set_title(f"{ticker} Price Chart with Stop Hunt Zones", fontsize=16)
ax.set_ylabel("Price")
ax.grid(True)
plt.setp(ax.get_xticklabels(), visible=False)
plt.tight_layout()
plt.show()


