Market Structure Trading Strategies
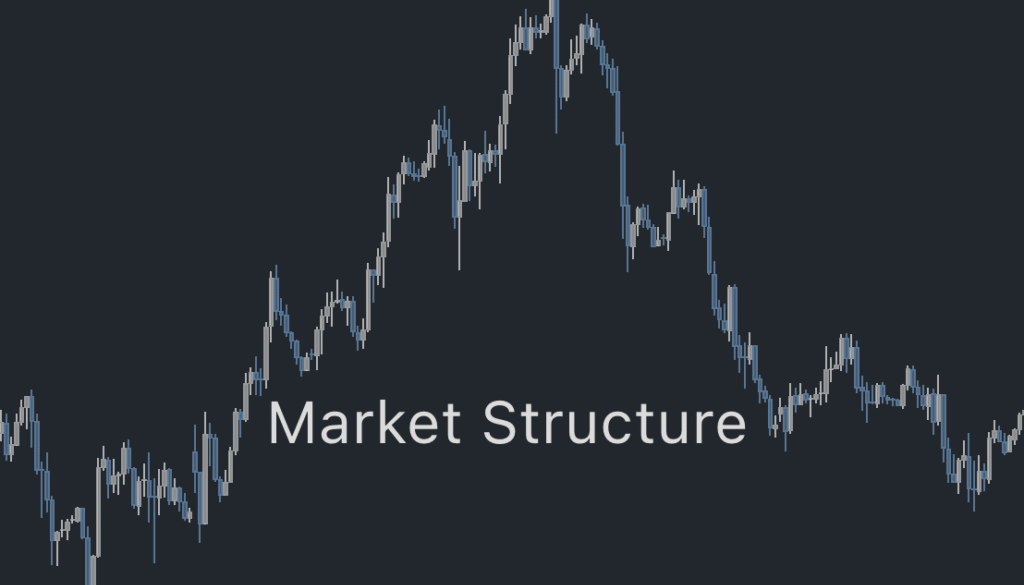
When you look at a price chart, it might seem like a bunch of messy ups and downs — but there’s actually a story being told. That story is called market structure, and once you learn how to read it, trading becomes a lot less confusing and a lot more fun.
Let’s break it down together in a simple and clear way.
What is Market Structure?
Market structure is just a fancy way of saying:
“What direction is the market going, and how is it moving there?”
We look for patterns in price to decide whether the market is:
Going up (an uptrend),
Going down (a downtrend), or
Going sideways (a range).
And how do we spot that?
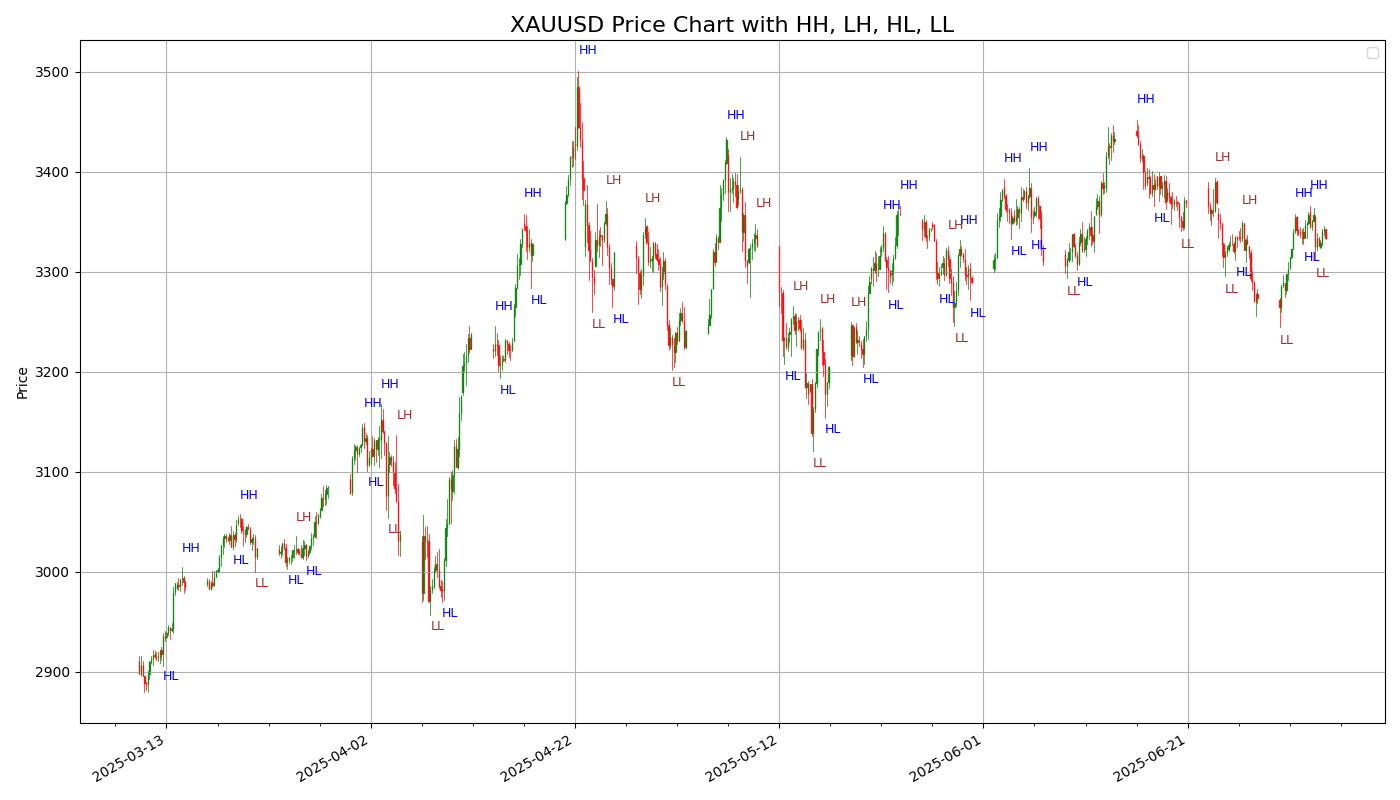
By using Higher Highs (HH), Higher Lows (HL), Lower Highs (LH), and Lower Lows (LL).
The Three Market Types
1. Uptrend
The price keeps making Higher Highs (HH) and Higher Lows (HL).
This means buyers are in control.
In an uptrend, we buy when price pulls back and forms a Higher Low, and then starts rising again.
2. Downtrend
The price keeps making Lower Highs (LH) and Lower Lows (LL).
This means sellers are in control.
In a downtrend, we sell when price bounces up (a Lower High), then starts falling again.
3. Range (Sideways Market)
The price bounces up and down between the same levels.
No clear HH/HL or LL/LH. It’s just going sideways.
💡 In a range, we usually wait or use different strategies like buying at the bottom and selling at the top of the range.
How to Use Market Structure to Trade
For Long (Buy) Trades:
Identify an uptrend with HH and HL.
Wait for the price to pull back (form a HL).
Enter when it starts moving up again.
Place a stop-loss below the HL.
Target a new HH.
For Short (Sell) Trades:
Identify a downtrend with LL and LH.
Wait for the price to bounce (form a LH).
Enter when it starts moving down again.
Place a stop-loss above the LH.
Target a new LL.
A Simple Way to Practice
Open any chart. Start from the left and move to the right.
Mark the Higher Highs and Higher Lows when price is going up.
Mark Lower Highs and Lower Lows when it’s going down.
You’ll start to “see” the rhythm of the market — and that’s your edge.
Pro Tips
Don’t rush. Wait for a clear structure before entering a trade.
Use volume or indicators like RSI for extra confirmation.
Combine with support/resistance zones for better results.
Always use a stop-loss. Protect your account first.
Final Thoughts
Market structure trading is simple but powerful. You’re not relying on complicated indicators — just watching how price behaves and joining the trend.
Once you master this, you’ll be surprised how clear the charts become. So next time you open a chart, don’t panic — just ask:
“Is this market making Higher Highs and Higher Lows, or Lower Highs and Lower Lows?”
And trade accordingly.
    from tvDatafeed import TvDatafeed, Interval
import pandas as pd
import numpy as np
import matplotlib.pyplot as plt
from matplotlib.dates import date2num, DateFormatter
from matplotlib.ticker import AutoMinorLocator
from mplfinance.original_flavor import candlestick_ohlc
from scipy.signal import argrelextrema
from datetime import datetime

# Initialize TVDataFeed
tv = TvDatafeed()

# Parameters
ticker = 'XAUUSD'
exchange = 'OANDA'
start_date = datetime(2024, 1, 1)
end_date = datetime.now()

# Fetch historical data
data = tv.get_hist(
    symbol=ticker,
    exchange=exchange,
    interval=Interval.in_4_hour,
    n_bars=500,
    extended_session=False
)

# Prepare DataFrame
data.index = pd.to_datetime(data.index)
data = data.rename(columns={
    'open': 'Open', 'high': 'High',
    'low': 'Low', 'close': 'Close',
    'volume': 'Volume'
})
data = data[(data.index >= start_date) & (data.index <= end_date)]

# Convert to OHLC for candlestick_ohlc
data_ohlc = data[['Open', 'High', 'Low', 'Close']].copy()
data_ohlc['DateNum'] = date2num(data.index.to_pydatetime())
data_ohlc = data_ohlc[['DateNum', 'Open', 'High', 'Low', 'Close']]

# Find Peaks and Valleys
n = 5
high_idx = argrelextrema(data['High'].values, np.greater_equal, order=n)[0]
low_idx = argrelextrema(data['Low'].values, np.less_equal, order=n)[0]

# Define structure labels: HH, LH, HL, LL
labels = []

# Compare recent extrema to previous to assign labels
for i in range(1, len(high_idx)):
    prev = data.iloc[high_idx[i - 1]]['High']
    curr = data.iloc[high_idx[i]]['High']
    label = 'HH' if curr > prev else 'LH'
    labels.append((data.index[high_idx[i]], data['High'].iloc[high_idx[i]], label))

for i in range(1, len(low_idx)):
    prev = data.iloc[low_idx[i - 1]]['Low']
    curr = data.iloc[low_idx[i]]['Low']
    label = 'HL' if curr > prev else 'LL'
    labels.append((data.index[low_idx[i]], data['Low'].iloc[low_idx[i]], label))

# Plotting
fig, ax = plt.subplots(figsize=(14, 8))
candlestick_ohlc(ax, data_ohlc.values, width=0.03, colorup='green', colordown='red', alpha=0.8)

# Annotate structure (HH, LH, HL, LL) closer to candles
for dt, price, lbl in labels:
    x = date2num(dt)
    y = price * (1.005 if lbl in ['HH', 'LH'] else 0.995)  # closer to the candle
    ax.annotate(lbl, xy=(x, y), xytext=(x, y), fontsize=9,
                color='blue' if lbl in ['HH', 'HL'] else 'brown')

# Format
ax.xaxis.set_major_formatter(DateFormatter('%Y-%m-%d'))
ax.xaxis.set_minor_locator(AutoMinorLocator())
fig.autofmt_xdate()
ax.set_title(f"{ticker} Price Chart with HH, LH, HL, LL", fontsize=16)
ax.set_ylabel("Price")
ax.grid(True)
ax.legend()

plt.tight_layout()
plt.show()


